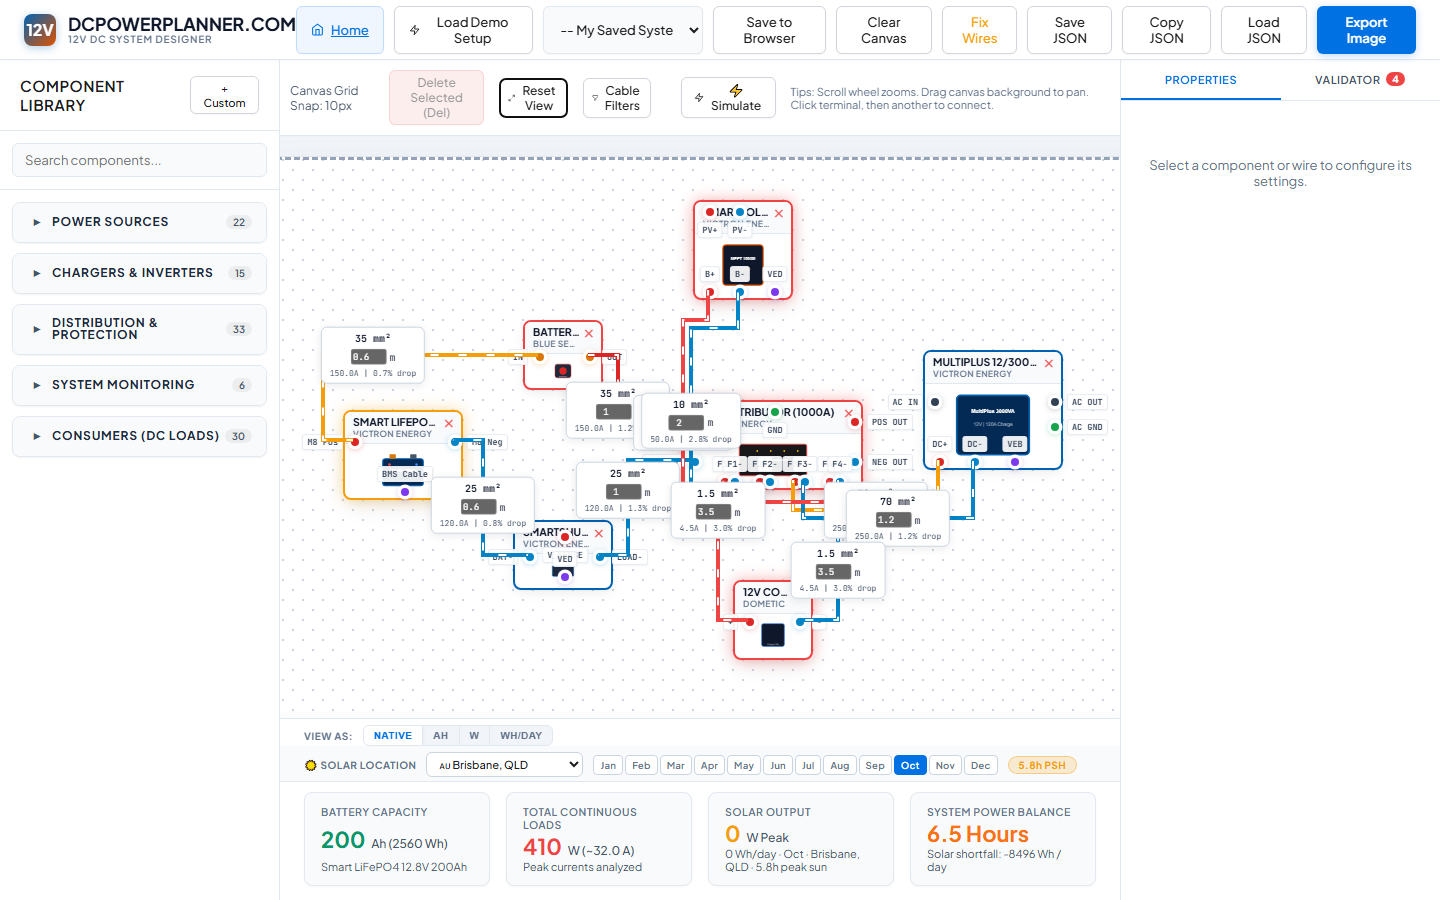
The Designer Layout
Get oriented with the three-panel interface before you start placing components.
Three Panels, One Canvas
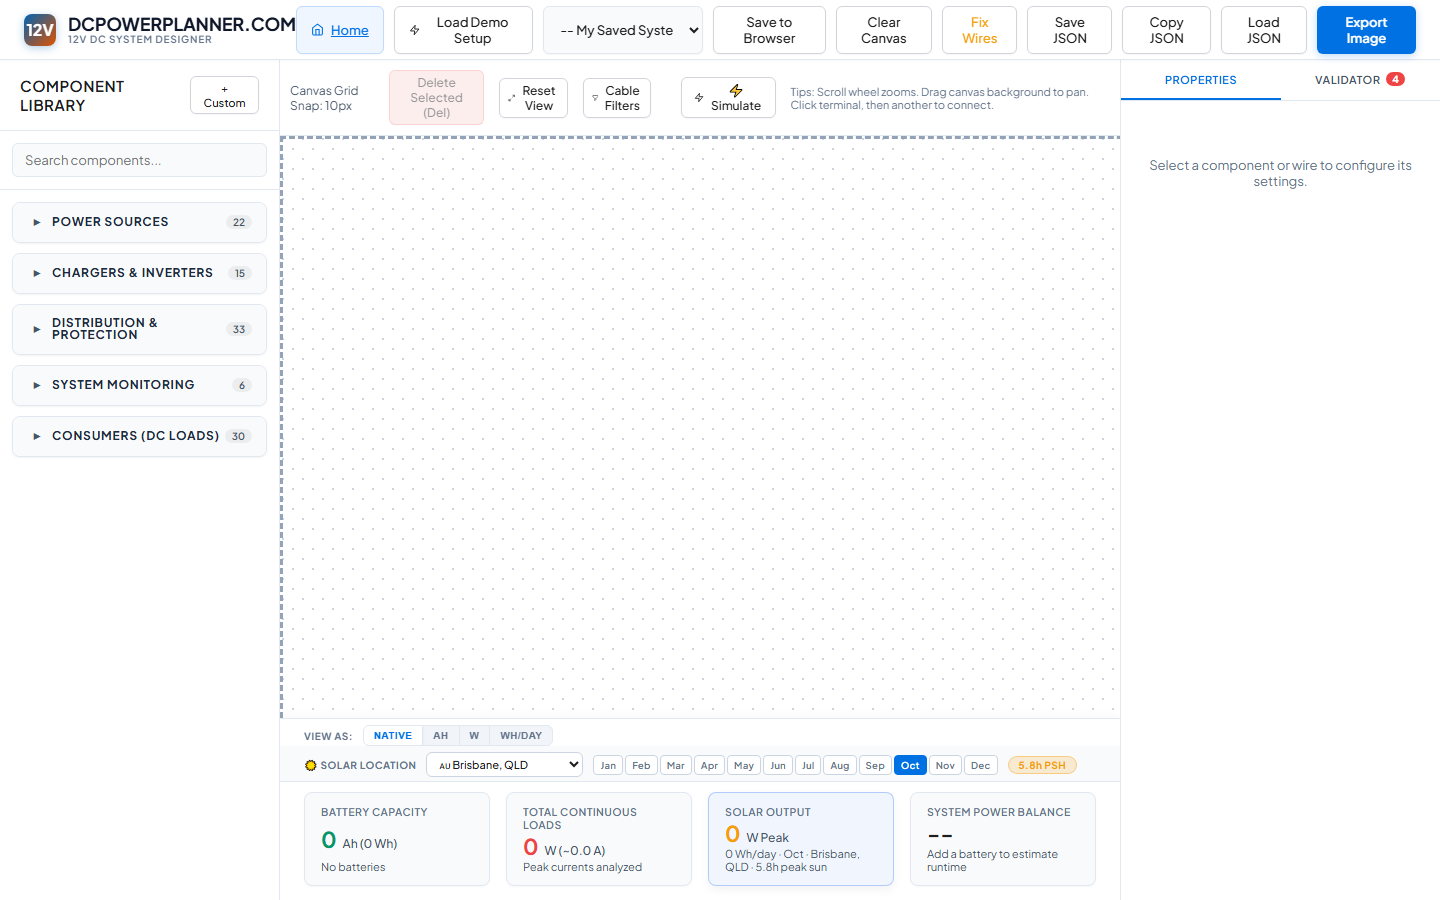
The DCPowerPlanner.com designer is built around three panels: the left panel is your Component Library, the central canvas is where you design your system, and the right panel shows Properties and Validation results. At the bottom is a live Statistics Dashboard that always shows your current system totals.
Navigating the Canvas
The canvas is large and fully scrollable. Use your mouse scroll wheel to zoom in and out. Click and drag on the canvas background (not on a component) to pan around. Click any component to select it. Use Reset View in the canvas toolbar to fit everything back into view after getting lost.
The Bottom Stats Dashboard
At the very bottom of the canvas area, four live stat cards update in real time as you build: Battery Capacity (total Ah and Wh), Total Continuous Loads (W and A), Solar Output (W max and daily Wh estimate), and System Power Balance. Click any stat card to highlight the relevant components on the canvas.